This page is no longer being updated from 31st March 2025.
Please visit Evelina London’s website here to view information and how to get involved.
Introduction
Our consultation has been shaped by what people have told us matters to them. The importance of travel was flagged, alongside five other areas of concern, by a survey with parents and children with experience of cancer treatment in south London, Kent, Medway, Surrey and Sussex undertaken on our behalf by the Association of Young People’s Health (a charity) in winter 2020/2021. The answers to this survey played an important role in shaping the evaluation criteria for the patient and carer experience key area (domain) subsequently used for the pre-consultation evaluation.
Discussions over the last three years in our advisory Stakeholder Group, which is mainly comprised of parents and representatives of children’s cancer charities, have raised concerns about how transport and travel to specialist children’s cancer services would be affected by our proposals.
It is important to note that children’s cancer care is complex, and our proposals would not and could not eliminate the need for children to go to different hospitals for specific kinds of expert care. Neurosurgery for children with cancer will continue at both King’s College Hospital in south east London and St George’s Hospital in south west London. Other types of specialist surgery for children with cancer are provided at King’s, Royal Brompton Hospital in Chelsea, Royal London Hospital in Whitechapel and Royal National Orthopaedic Hospital in Stanmore. Proton beam and other very specialist types of radiotherapy are at University College London Hospitals. Some very specialist interventions can only be provided at Great Ormond Street Hospital. Travel to these sites will remain unaffected by the change we are consulting on.
It is also worth noting that there are large and successful Principal Treatment Centres including the one at Great Ormond Street which do not have any, or very limited on-site parking for children and families.
Understanding that travel to the future Principal Treatment Centre is an issue of concern for families, we have looked at travel in a number of different ways:
- in our pre-consultation options appraisal, travel times for patients and staff contributed to the scores for the two options (in the patient and carer experience key area, and the enabling factors key area respectively). This was done through a statistical (quantitative) assessment and scored using an agreed process. Detail of this is set out below.
- for our Equality and Health Inequalities Impact Assessment which is part of our Integrated Impact Assessment. Whichever option is chosen, there will be some children and families with shorter journeys and some with longer journeys. Our detailed Equality and Health Inequalities Impact Assessment looks at the impact on families, with a particular focus on those with fewer choices, and shows how negative impacts could be addressed.
A lot of care was taken to look at the right measures (metrics) for both pieces of work. We weren’t able to investigate all the aspects of travel that stakeholders asked us to look at because the information simply wasn’t available: for example, the different costs of travel or the impact of travel access on working patterns for parents trying to work and care for sick children.
We have also surveyed parents more recently on how they travel to the current Principal Treatment Centre at St George’s Hospital and The Royal Marsden.
The information set out here describes:
- survey responses from children and families about travel for cancer services
- the approach taken to travel time analysis for our proposals
- how patients’ travel times were weighted, assessed and scored for the options appraisal
- how patients’ travel times were assessed for the equality assessment – and recommendations for reducing impacts
- staff travel time analysis for the options appraisal.
Some of this is quite technical. It will be of interest to people who want to understand the detail about this work. We have tried to make it easy to follow. There is a short glossary at the end explaining the technical terms in more detail. If you want help to understand this information, please contact us at 0800 135 7971 or on england.childrenscancercentre@nhs.net.
1) Surveys with families on travel
We have used two main pieces of work to hear directly from children with cancer and their families who use current specialist cancer services at St George’s Hospital and The Royal Marsden on travel and access to care.
Ward-based patient surveys
We are engaging with children currently undergoing treatment and their families and completing surveys with them. As part of these surveys, families are asked questions about how they travel to their appointments at St George’s Hospital and The Royal Marsden, and how long their journeys are. Out of 88 respondents:
- 81% said they travelled by car (whether their own vehicle or a taxi)
- 11% said they travelled by public transport
- 6% said they used hospital provided transport
- 1% said they travelled by bicycle
- 1% said they travelled by foot
- 65% said their journey took less than one hour
- 35% said they travelled for more than one hour
Surveying patients and their families is a good way of understanding the daily reality for them of travelling to appointments, including the costs and complexity of their journeys. However, it can be subject to being skewed, which can give a misleading picture. One way this could happen would be if the only people who answered the survey lived very close to the centre. Or very far away from the centre. Or were not sure how long their journeys took. Or if, for some reason, the journey they took that day was very different from normal.
Differences in how patients reach Principal Treatment Centres can be due to where hospitals are located; however, in every situation it is vitally important to support children to access the life changing care they need.
Association of Young People’s Health survey findings
As mentioned above, the Association of Young People’s Health undertook a survey on our behalf, to find out what mattered to children and parents with experience of cancer services. Information about the survey was shared with parents and families by Guy’s and St Thomas’ NHS Foundation Trust (Evelina London treats some children every year who have cancer for other, sometimes related, conditions and Guy’s is a designated hospital for cancer services for teenagers and young adults), St George’s University Hospitals NHS Foundation Trust and The Royal Marsden NHS Foundation Trust. Some 150 parents and 50 children and young people responded to an open invitation to participate in the survey advertised by these hospitals. Again, this was not a representative sample, but an important representation of the views of these specific people. Travel was one of six areas of importance that they mentioned. The points below reflect the main comments they made about travel.
- The young people thought that the distance to travel (especially in an emergency situation) and availability of public transport were important factors.
- Parents also thought distance was important, as well as the availability and cost of parking at the Principal Treatment Centre location.
- Other concerns expressed were about travelling into London (for those who live outside London) and the challenges of travelling with an unwell child by car and on public transport.
2) Approach taken to travel time analysis for our proposals
As well as listening to parents, children and young people through surveys, we also sourced statistical travel time analysis. Experienced independent NHS analysts measured travel times for us, looking at two different population samples using a statistical (quantitative) measure.
They:
- modelled travel times for actual patients in 2019/20, using anonymised data
- modelled travel times for all children living in the catchment area whether they have cancer or not. This was supplemented by analysis for children living in areas where the nearest children’s cancer shared care unit is in the catchment area, even if their homes are not.
The analysis was carried out by the Insights Team, NHS North East London. This is an external team to NHS England with experience of travel time analysis for large service reconfigurations. They used a standard approach.
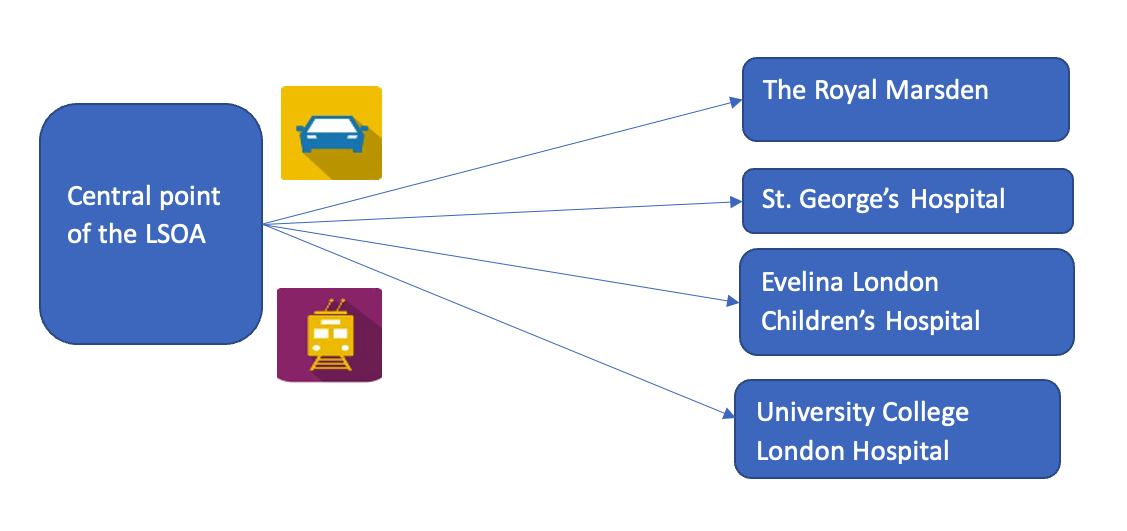
Travel time modelling software was used to generate public transport and car journey travel times for all children (either living in the Principal Treatment Centre catchment area (and border areas) or who were cared for by the service in 2019/20) to each of Evelina London, St George’s Hospital and The Royal Marsden’s site in Sutton.
The starting point for each modelled journey was the small geographic area in which people live, known as their ‘Lower Super Output Area* (LSOA) of residence’. This was the case even when modelling journey times for actual patients from 2019/20. About 1,500 people live in each Lower Super Output Area. They are the smallest geographical area to have estimates of the number of people who live there, based on the Office for National Statistics (ONS) population estimates for 2021.
There are 4,000 Lower Super Output Areas in the Principal Treatment Centre catchment area and 435 Lower Super Output Areas were used in the patient cohort analysis, which used the anonymised data of actual patients from 2019/20. Travel times were for the quickest trip departing from ‘resident origin’ (which is the central point of the Lower Super Output Area) for arrival at the destination at midday on a Wednesday.
The modelling used both road networks and timetabled transport networks. Potential travel methods for each journey by public transport included a combination of national rail, tram, light rail, tube, bus, coach, ferry, and walking to and from stops and interchange, and just walking if that was quicker. A public transport journey was only measured if a station or stop was reachable within an initial 20 minute walking time (which was the case for all but 0.2% of LSOAs).
This resulted in several large sets of data, each recording all the travel times for one of the different types of journey – by different population groups travelling by public transport and by road to each of the three locations. Travel times for each were arranged in order, from the smallest to the biggest. The travel time in the middle (mid point/median) was found, as well as the travel time at the 90th percentile (that is the travel time below which 90% of all other travel times lie). This was used to make the different comparisons that were then carried out to understand the experience of different groups travelling from different parts of the catchment areas to the different destinations by public transport and by road.
The travel measures provide a typical indication of the quickest journey from origin to destination. The analysis cannot take account of differences in performance of different forms of public transport on any given day, and individual experiences may not be the same as the estimated times.
Before deciding which data to use for the options appraisal analysis, a sensitivity analysis was undertaken. This compared the results from using data for actual patients and using data for all children in the catchment area. This showed that the mid-point (median) driving time to the current Principal Treatment Centre at The Royal Marsden using journey times for actual patients was 56 minutes, whereas using journey times for all children in the catchment area, it was 59 minutes. There was no difference between the patient and catchment population groups for public transport journey times to The Royal Marsden. As the two methods give results that are consistent with each other, we used the method based on modelled journey times for actual patients.
The rest of this factsheet aims to describe what the two methods measured and how the results have been used. Due to the drawbacks of survey-based information described above, statistical methods were used to score travel times for patients and for staff as part of the options appraisal process. Nevertheless, the survey data is really important for adding context to the statistical analysis. It has been incorporated into the Integrated Impact Assessment alongside the statistical analysis.
3) Patients’ travel times used in the options appraisal
Weighting of the ‘service accessibility’ (travel times) sub-criterion for the options appraisal
The options appraisal, which helped us to compare and assess the two options for the future Principal Treatment Centre ahead of going to consultation, was complex. It drew on the expert knowledge and experience of clinicians, managers, parents, charities, staff and research leads, and the views of children and families.
Working with the programme, they supported us to develop criteria which identified:
- the key areas (domains) that are most important for the future service. Four key areas were identified, reflecting the complex range of factors to be considered in making a decision on the future site of this service.
- the specific aspects of the key areas we should focus on as ‘sub-criteria’ to help us assess the two options in detail.
They also played an important role in deciding how the sub-criteria should be “weighted” in the scoring depending on their importance. ‘Weighting’ recognises that although different factors need to be considered, some may be more important than others.
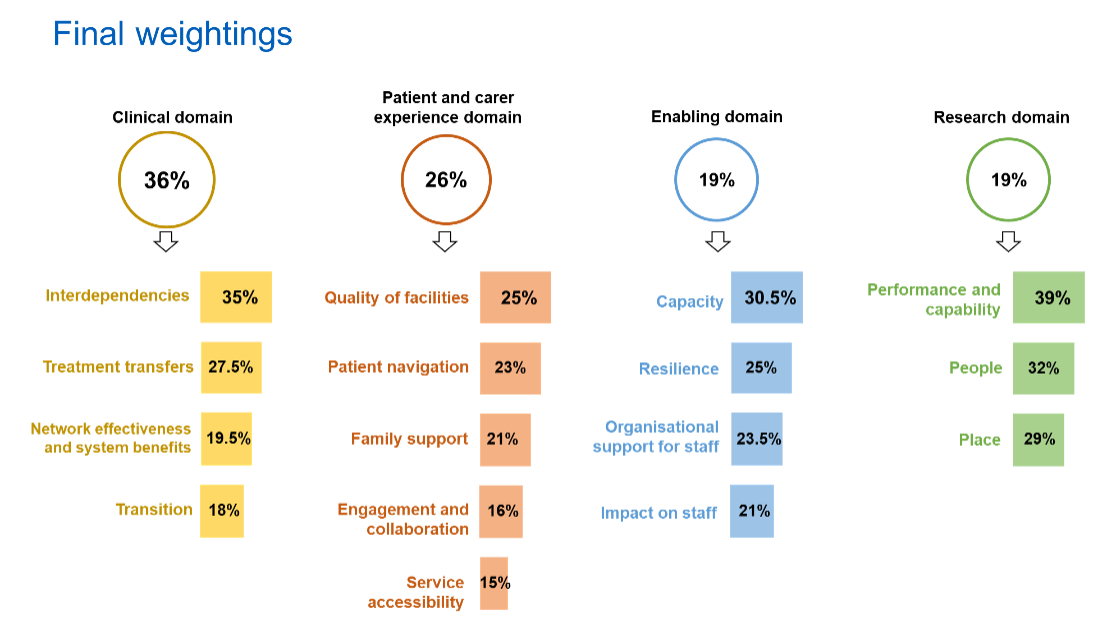
Four expert panels each weighted the sub-criteria for their key area. The expert panel for the patient and carer experience key area weighted all the sub-criteria including travel. The four panels also did the assessment and scoring of most sub-criteria for their key areas – but not travel times. They were assessed and scored using the approach set out in this information sheet but weighted in terms of importance by the expert group.
The diagram below shows the weightings for all the sub-criteria in the patient and carer experience key area, with service accessibility (travel) highlighted. Service accessibility was clearly seen as important but as one of a number of aspects of patient and carer experience that had to be taken into account in the evaluation of the two proposals.
What was measured
The patient cohort-based analysis used for the options appraisal looked at travel times for all the patients who were treated as day cases or inpatients by The Royal Marsden during 2019/20 (the ‘patient cohort’), regardless of where they lived.It included children who received inpatient care and lived outside the formal Principal Treatment Centre catchment area.
Using anonymised data and the method described above, it modelled their journeys to The Royal Marsden and their journeys to each of the potential future locations, Evelina London Children’s Hospital and St George’s Hospital. It also took account of multiple trips made by some families. Then it compared the differences.
The measure (metric) used was the proportion (%) of patient journeys with a 15 minute or more increase in journey time to potential future sites for the Principal Treatment Centre compared to current journeys to the current Joint Principal Treatment Centre (whether The Royal Marsden or St. George’s). Fifteen minutes was chosen as the cut-off because we considered this was a change in journey time that would feel like a significant increase. It is also the cut-off used in many other NHS service change programmes. We recognise that how long feels like a significant increase is personal and will differ between individuals.
The data was then converted to a score using a sliding scale. The scoring worked like this:
- if 75% or more of journeys had a 15 minute or more increase, the score would be 0 (the minimum)
- if 5% or less of journeys had a 15 minute or more increase, the score would be 10 points (the maximum).
Increases affecting more than 5% and less than 75% of journeys would score between 0 and 10, using an agreed scale.
It was recognised that access is particularly difficult for people with less money to spare, so the impact on patients living in ‘deprived’ areas was given a bigger share of the scoring. The analysis also considered the impact of changes in public transport access and car travel. The final score was made up of four elements. The first two were:
- For journeys by public transport: patients living in areas categorised as being in the most deprived 20% of areas in England (in quintile 1 in the IMD 2019)
- For journeys by public transport: patients living in areas in the less deprived 80% of areas in England (in IMD quintiles 2-5 combined)
These two scores were added together and divided by two to find the average for public transport – Score A in Table 1 below.
The other two were:
- For journeys by road: patients living in areas categorised as being in the most deprived 20% of areas in England
- For journeys by road: patients living in areas in the less deprived 80%.
These two scores were added together and divided by two to find the average for journeys by road – Score B in Table 1 below.
The scores for public transport and car travel times were then combined, with an equal weighting given to each type of travel. That meant half of patients were assumed to travel by car and half by public transport. This produced the final score (score C in Table 1 below).
Table 1 below illustrates how the service accessibility score was calculated. This was undertaken for both Evelina London (table 2) and St George’s Hospital (table 3) to calculate a score for each of them. The reason the total journey times are different for the two is that some patients were seen only at St George’s Hospital. The impact of the move on these patients and their journey times, should the service move to Evelina London, was also calculated.
The following tables (2 and 3) show the actual travel times scores for the two options for the proposed future Principal Treatment Centre.
| Travel Type | Index of Multiple Deprivation Quintile | Number of journeys with 15+ minute increase | Total number of journeys | % of journeys with 15+ minute increase | Score |
|---|---|---|---|---|---|
| Public transport | 20% most deprived | Number | Number | % | |
| Public transport | Other 80% | Number | Number | % | |
| Public transport | IMD deprivation quintiles combined | Average of results above: % | Score A | ||
| Car | 20% most deprived | Number | Number | % | |
| Car | Other 80% | Number | Number | % | |
| Car | IMD deprivation quintiles combined | Average of results above: % | Score B | ||
| Travel modes combined | All areas combined | Overall Score C (average of scores of A and B) |
| Travel Type | Index of Multiple Deprivation Quintile | Number of journeys with 15+ minute increase | Total number of journeys | % of journeys with 15+ minute increase | Score |
|---|---|---|---|---|---|
| Public transport | 20% most deprived | 10 | 675 | 1.48% | |
| Public transport | Other 80% | 312 | 4,114 | 7.58% | |
| Public transport | IMD deprivation quintiles combined | Average of results above: 4.53% | Score A: 10.00 | ||
| Car | 20% most deprived | 472 | 675 | 69.93% | |
| Car | Other 80% | 2,971 | 4,114 | 72.22% | |
| Car | IMD deprivation quintiles combined | Average of results above: 71.08% | Score B: 0.56 | ||
| Travel modes combined | All areas combined | Overall score C (average of scores of A and B): 5.28 |
| Travel Type | Index of Multiple Deprivation Quintile | Number of journeys with 15+ minute increase | Total number of journeys | % of journeys with 15+ minute increase | Score |
|---|---|---|---|---|---|
| Public transport | 20% most deprived | 10 | 627 | 1.59% | |
| Public transport | Other 80% | 195 | 3,855 | 5.06% | |
| Public transport | IMD deprivation quintiles combined | Average of results above: 3.33% | Score A: 10.00 | ||
| Car | 20% most deprived | 312 | 627 | 49.76% | |
| Car | Other 80% | 1,895 | 3,855 | 49.16% | |
| Car | IMD deprivation quintiles combined | Average of results above: 49.46% | Score B: 3.65 | ||
| Travel modes combined | All areas combined | Overall score C (average of scores of A and B): 6.82 |
It should be noted that in the table of overall scores shown in the pre-consultation business case (tables 39 and 40) the scores are shown in percentage terms rather than a score out of 10, i.e., 52.8% for Evelina London and 68.2% for St George’s Hospital.
Sensitivity analysis on evaluation criteria weighting between public transport and travel by car
An additional ‘sensitivity’ check was undertaken on patient travel times to reflect a scenario where more people used private road travel. In this test, the proportion assumed to be going by public transport was reduced to 30% (on the understanding that not all parents would have a car) with the proportion assumed to be going by private car increasing to 70%. This made no difference to the overall outcome of the options appraisal.
Since this sensitivity analysis, more information has been gathered on how families typically travel to their appointments. As described above, our data so far, from asking children, young people and families currently undergoing treatment how they travel to The Royal Marsden and St George’s Hospital, found 81% of people said they travelled by car, including those who travelled by taxi, and 11% said they travelled by public transport.
In addition, in June 2023, the charity Young Lives Versus Cancer published research exploring the costs for young cancer patients and their families of travelling for treatment. This included asking families which forms of transport they used most often to get to and from treatment. 91% said they mostly travelled by car. Other forms of transport that were used were non-emergency hospital transport (17%), taxi (16%) and train (14%). It should be noted that respondents could select more than one type of transport (meaning that the proportions will add up to more than 100%) and also that this was a national report, and not specific to the Principal Treatment Centre for children living in much of the south east and all of south London.
This extra data indicates that public transport might be used by as few as 10 to 15% of families, alongside other forms of transport such as taxi or hospital transport. We undertook further sensitivity testing as a result. This showed that, even if public transport was assumed to be 10% to 15%, the impact on the service accessibility score would not change the overall outcome of the options appraisal. Guy’s and St Thomas’ proposal on behalf of Evelina London would still score higher than St George’s proposal on behalf of St George’s Hospital.
4. How patients’ travel times were assessed for the equality assessment – and recommendations for reducing impacts
The population-based analysis looked at the modelled travel time for every child aged one to 15 living in the Principal Treatment Centre catchment area and explored differences in travel times between socio-demographic groups. It did not attempt to put this understanding into a ‘score’ to differentiate between options.
It helps us to understand the impact of the change on groups with protected characteristics or other vulnerabilities, so that any negative impacts could be addressed.
It modelled the journeys that could be made by all the children living in the Principal Treatment Centre catchment area, whether or not they have cancer. This was based on the Office for National Statistics population estimates for 2021, which showed us where children live.
It looked at every local area where children live, rather than just the patients who used the service in any given year. It therefore provides a very comprehensive picture of potential impact in the future (as we cannot tell where future patients will be living). However it cannot take account of multiple journeys by families.
It worked out the travel times for their journeys to The Royal Marsden and their journeys to each of the potential future locations, Evelina London Children’s Hospital and St George’s Hospital. It did not compare the potential future locations with each other. We also considered changes in travel time to University College London Hospital, compared The Royal Marsden, to account for the impact on those children who require radiotherapy.
The measures used were:
- changes in the mid point (median) travel times in minutes between The Royal Marsden and each of the possible locations for the future centre. We also included changes to travel times for those with the longest journeys. This was represented by the 90th percentile travel time, that is the travel time below which 90% of all other travel times lie. The purpose of choosing the 90th percentile, rather than the absolute maximum, is to reduce the impact of outliers and avoid drawing conclusions about journey time based on small numbers of children.
- changes in the number (cumulative proportion) of children in the catchment area who could reach the future Principal Treatment Centre in 15 minutes, 30 minutes, 45 minutes and so on.
The different groups in our catchment area looked at were:
- London compared to south east areas
- children living in areas categorised as being in the most deprived 20% of areas in England compared to all children (IMD 2019).
- children living in areas designated as rural compared to urban areas.
The analysis was carried out for journeys by both public transport and road.
To support discussions with local authorities and other stakeholders, a further analysis compared the changes in travel time from each of the local authorities to both the two potential locations. This allows us to give local authorities clear information about the impact on their populations including their more vulnerable groups. This analysis also included children living in border areas whose nearest children’s cancer shared care unit is inside the catchment area, meaning their care is led and coordinated by The Royal Marsden in partnership with St George’s Hospital. The additional areas for this analysis were the boroughs of Crawley, Horsham and Mid Sussex which are in the county of West Sussex, which is outside the formal catchment area, but where the nearest shared care unit is at Redhill, Surrey, which is in the catchment area.
Recommendations for mitigation (reduction) of negative impacts of additional travel requirements
Using the approach described above, our equality assessment looked at the impact of the proposed changes on travel time for different groups. It found that:
- by public transport, children living in the most deprived areas and rural areas would, on average, have a shorter journey for both options than to The Royal Marsden compared to other children
- by road, children living outside London or in rural areas would, on average, have a longer journey for both options than to The Royal Marsden, compared to other children.
- Radiotherapy services: travel time analysis found travel time by road will increase on average by 22 minutes to University College London Hospital (as compared to The Royal Marsden) whilst the same journey by public transport will reduce by 27 minutes.
We recognise that parents and families are worried about travelling by public transport with a severely ill or immunosuppressed child. They are also worried about driving into London, with the costs, the congestion, and difficulties parking.
The group advising on our equality assessment has made recommendations for the future Principal Treatment Centre on how to reduce the impact of this change on families, including:
- If a child has a medical need that prevents them using public transport, they are eligible for patient transport. Guy’s and St Thomas’, St George’s and University College London Hospital have dedicated patient transport teams.
- Both Guy’s and St Thomas’ and St George’s will offer parking for children and families accessing children’s cancer care.
- All organisations would be able to reimburse parking and support parents of children with cancer to access reimbursement for Ultra Low Emission Zone (ULEZ) and congestion zone charges
- As now, families on low income or benefits may be able to reclaim public transport costs under the Healthcare Travel Cost Scheme
- Evelina London’s volunteers would support families as mobility assistants, especially families with disabilities. Evelina London’s proposal explained that a review was underway to create more disabled spaces and increase access to free parking who parents who need it. There would also be a volunteer driver scheme.
- St George’s helps families with travel arrangements for appointments and to make the journey home by taxi or patient transport after a hospital stay.
Further information on recommendations for reducing the negative impacts is provided in the Integrated Impact Assessment.
5) Staff travel times analysis for the options appraisal
As part of an overall assessment of the impact of the proposed service change on staff for the options appraisal, staff travel times were explored.
The same independent analysts described in section 2 undertook a travel times analysis. This was based on the Lower Super Output Areas (LSOA) of residence for staff working at The Royal Marsden who would be eligible to transfer to the future centre, if they so wished, and for staff working at St George’s Hospital who would be eligible to transfer to Evelina London if the future centre was there rather than at St George’s, and they wished to transfer. There were 201 staff across 180 Lower Super Output Areas. The staff travel times analysis was based on public transport times only and looked at the percentage of staff whose journey to the potential locations for the future Principal Treatment Centres would be more than 15 minutes longer than their current travel time to The Royal Marsden. The findings of this analysis, which are summarised below, are described in more detail in section 5.4.4 of the pre-consultation business case.
| Method of travel | Longer journey than to work currently (by more than 15 minutes) | Longer journey than to work currently (by more than 15 minutes) | Faster or very similar journey than to work currently (no more than 15 minutes longer) | Faster or very similar journey than to work currently (no more than 15 minutes longer) |
|---|---|---|---|---|
| Evelina London | St George’s | Evelina London | St George’s | |
| Public transport | 39.30% | 34.50% | 60.70% | 65.50% |
This was one part of the scoring for the impact on staff sub-criterion which was assessed as part of the enabling (non-clinical) factors key area.
We recognise that the vast majority of staff at The Royal Marsden currently drive, walk or cycle to work and this is unlikely to be possible after the move.
We analysed average travel times for staff who drive to work at The Royal Marsden and found it is 32 minutes. Travel times to work by public transport would increase to 70 minutes to Evelina London or 69 minutes to St George’s.
To find out how St George’s staff who work for the current Principal Treatment Centre (not just those who might transfer to the new service) get to work, we asked them some questions. Of those who responded, 42% said they travel by public transport, 23% by bike, 21% by car and 14% on foot. More than half of those who replied said it takes them less than 30 minutes (10% under 15 minutes and 48% 15-30 minutes), 17% take 31-45 minutes and 20% take 46 minutes to an hour.
Help with costs
Staff would be able to claim back extra travel costs caused by the move for up to four years, as part of their protected rights. Whichever hospital was the site of the future Principal Treatment Centre, they would also be entitled to inner London weighting, which is worth an extra 5% of their pay.
Glossary
| Term | Explanation |
|---|---|
| Index of Multiple Deprivation (IMD) and IMD quintiles | These are widely-used datasets within the UK to classify the relative deprivation (essentially a measure of poverty) of small areas. Multiple components of deprivation are weighted with different strengths and compiled into a single score of deprivation. IMD classifies these areas into five quintiles (each covering 20%) based on relative disadvantage, with quintile 1 being the most deprived and quintile 5 the least deprived. |
| Integrated Impact Assessment (IIA) | The Integrated Impact Assessment is a piece of research that tells us about the potential positive and negative impacts of proposed changes to services on people who live in the area. It also lists a set of potential solutions that may help to address some of the issues identified as having a negative impact on a particular group or community, for example transport solutions. |
| Lower Super Output Area (LSOA) | LSOAs are a small area averaging about 1,500 people. Each LSOA has a population weighted centroid (PWC) which represents the centre of the LSOA, taking into account where people actually live e.g. if a LSOA is largely rural with a town in the east, the PWC would be set towards the east, rather than in the exact centre. The PWC serves as the origin of each modelled journey. Population estimates are available at LSOA level and each LSOA is assigned an Index of Multiple Deprivation (IMD) score and an urban/rural classification. This allows for travel time analysis by these variables. |
| Median | The median is the mid-point of a set of numbers arranged in order from the smallest to the largest. It is a good approach because it gives the number closest to most people’s experience. |
| Patient cohort | This refers to a group of patients. For our analysis, it means all the children with cancer who, in 2019/20, were seen as a day case or had an overnight stay at The Royal Marsden NHS Foundation Trust. Their anonymised data was used, so they could not be identified. |
| Protected characteristic | It is against the law to discriminate against someone because of: agedisabilitygender reassignmentmarriage and civil partnershippregnancy and maternityracereligion or beliefsexsexual orientation These are called protected characteristics. |
| Sub-criterion | We use the word sub-criterion to refer to one of the elements of the four key areas (also called domains) which were assessed and scored for the options appraisal. The four key areas were clinical, patient and carer experience, enabling (non-clinical factors) and research. |
| Weighting | Weighting decides how many marks a particular criterion or factor can get. The higher the weight, the more marks it can get. This is a way of making sure the most important criteria get a larger proportion of the marks. |